Posts

Radiation Network

Image
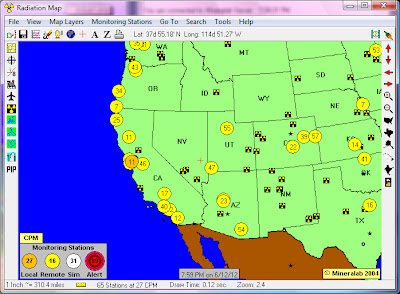
I purchased GeigerGraph for Networks from Mineralab, and joined the radiation network , which is a network of volunteers all over the world with radiation monitoring stations that report local CPM (counts per minute) ratings. In the graph below, you can see my station in the East Bay in slightly darker yellow. I can highly recommend this software. The maps show active monitoring stations all over the world, and one can obtain more detailed information for each station. The software also generates graphs or spreadsheets of measured data, and allows specifying alert actions, such as sending an email, when CPM ratings exceed a certain maximum. The software can also post a  real-time map on a server .

Geiger Counter Continued

Image
I investigated the large variation observed in the graph of June 6. While babysitting the monitoring software, I noticed that occasionally the software would report bursts of over 200 CPM, even though the Geiger counter itself never measured such a spike. Two "faulty minutes" in one hour could easily explain the 400 clicks variation. Therefore, I first tried different serial/USB converters (settings were always as specified by the GC manufacturer), since low quality converters are notorious for messing up signals. But I noticed faulty burst even for expensive converters. Then I tried my only computer that still has a serial port. Now, no more faulty bursts occurred during several test runs. After that, I redid the 24 hours experiment. The results are shown below. A much more stable graph, reporting around 700 CPH, or .1 μSv/hour, which translates into about .9 mSv/year. I am glad I am now able to perform more reliable measurements. If anyone has suggestions on debuggi

Geiger Counter

Image
I got a Digital Geiger Counter for my birthday (yes, I know, geeky). As a starter use, I measured the background radiation in our house in the East Bay over the past 24 hours. The results appear in the graph below, plotting the "counts per hour" and corresponding μSv/hour over the past 24 hours. The worst-case measured .2 μSv/hour translates to about 1.8 mSv/year, which luckily seems a bit below the worldwide average background dose.

Solar Eclipse 2012

Image
We made a road trip to Mount Shasta and back to view the solar eclipse 2012, Armed with a home-made pinhole camera made by two shoe boxes, we watched the eclipse in a safe way.  

The Checker Maven

Bob Newell's The Checker Maven is a very interesting online publication on Checkers and Draughts. This week's issue features checkers applications for Android. Bob looked at many checkers programs but concluded that the only two application that merit consideration are Checkers Tutor, by world class checker programmer Martin Fierz (author of CheckerBoard and the Cake computer engine), and .... Checkers for Android by yours truly! I am honored to receive this special mention by The Checker Maven. You can find the summary article at the main page . A more elaborate overview, including interviews with Martin and myself and be found in the full article . Many thanks to Bob for posting this article.