Posts

Showing posts with the label geiger counter

Monitoring Stations in the Bay Area

Image
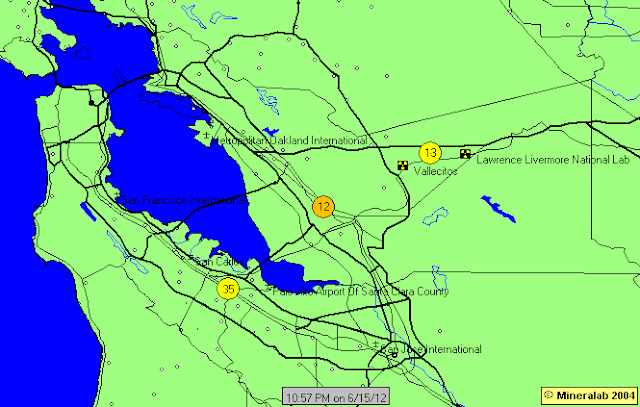
Below a more detailed view of all monitoring stations in the Bay Area that are part of the radiation network , where my station shows in slightly darker yellow. The station near LLNL usually shows a similar CPM rating, while the one in the South Bay usually shows a bit higher CPM. As long as my station is up, you can also view this real-time map .

Radiation Network

Image
I purchased GeigerGraph for Networks from Mineralab, and joined the radiation network , which is a network of volunteers all over the world with radiation monitoring stations that report local CPM (counts per minute) ratings. In the graph below, you can see my station in the East Bay in slightly darker yellow. I can highly recommend this software. The maps show active monitoring stations all over the world, and one can obtain more detailed information for each station. The software also generates graphs or spreadsheets of measured data, and allows specifying alert actions, such as sending an email, when CPM ratings exceed a certain maximum. The software can also post a  real-time map on a server .

Geiger Counter

Image
I got a Digital Geiger Counter for my birthday (yes, I know, geeky). As a starter use, I measured the background radiation in our house in the East Bay over the past 24 hours. The results appear in the graph below, plotting the "counts per hour" and corresponding μSv/hour over the past 24 hours. The worst-case measured .2 μSv/hour translates to about 1.8 mSv/year, which luckily seems a bit below the worldwide average background dose.